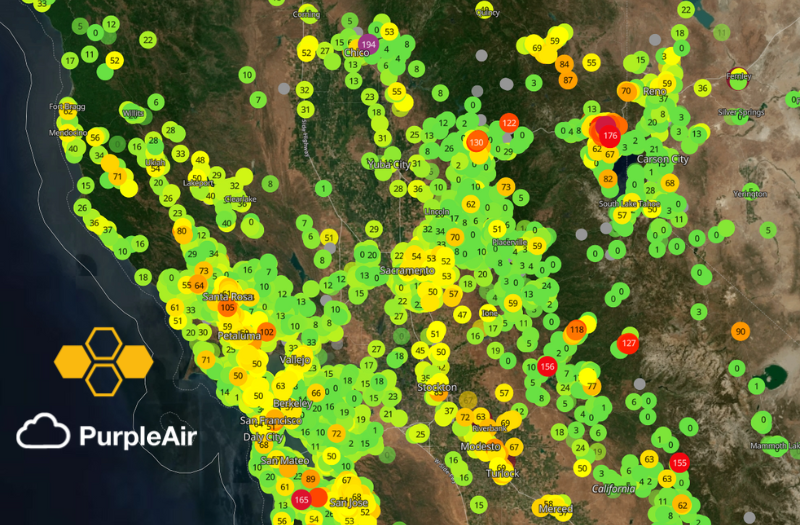

A few weeks back I gave a talk at Current, the Kafka Summit in Austin, Texas. The talk was a demonstration of how you can use online machine learning techniques and Bytewax stateful operators to detect when there is either a malfunctioning sensor or a smoke event due to a nearby fire. The dataflow used real data from PurpleAir, which is a community-driven air quality data site. The data was downloaded and then loaded into a Kafka topic and then consumed in a Bytewax dataflow to simulate real-time.
Living in California, I often use PurpleAir data to check out the air quality in my local area or before planning a weekend camping trip. To automate the process, I wanted to figure out a way to do this with Machine Learning. It seemed straightforward to use anomaly detection methods to determine if a sensor was registering a measurement that was out of the ordinary, but not as straightforward to differentiate between a malfunction and an increase due to smoke from a wildfire.
This post covers the machine learning methods and heuristics that were used and how you can enable similar aggregations, windowing and stateful objects in your dataflows. To see the code in its entirety, you can check out the repository or the google colab notebook.
Anomaly Detection with Online Machine Learning
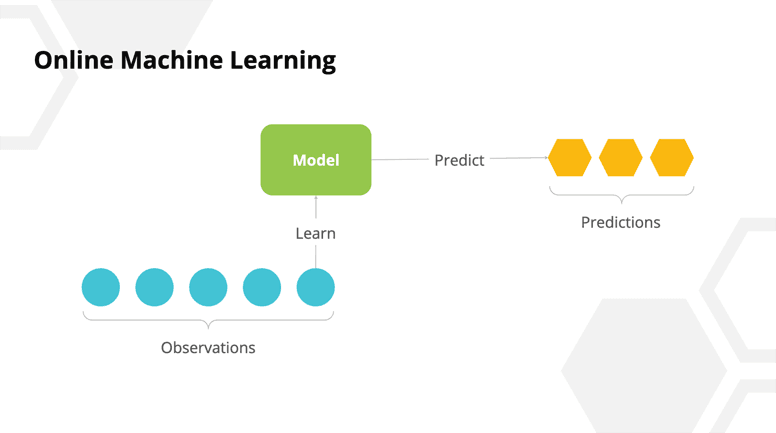
Before we move on to how we differentiated between malfunctions and smoke detection, we will take a brief detour into the world of online machine learning. Online machine learning is a subset of online algorithms that allow you to update a model with each new datum. This is in contrast to training the model with the entirety of the data at once.

Online Machine Learning in Python
In the Python ecosystem, there is a library called River that allows you to leverage online algorithms in a Pythonic way. Since we are using Bytewax, it is convenient that we can just import and use the library within our normal flow.
River ML algorithms for anomaly detection follow a pattern like the one (psuedo code) shown below:
model = anomaly.Algorithm(**parameters)

for datum in data:
  score = model.score(datum)
  Model = model.learn_one(datum)
A model is a stateful object that is updated incrementally and in real-time with each new value and can also score each value. In our use case, where we have many sensors, we want a model for each different sensor so we don’t have the data from different sensors interfering with the score. This pattern fits well with Bytewax because we could use it in a stateful map, which is a Bytewax operator that will allow us to group incoming data by a key, create and maintain an object in memory, and update it with each additional value. Let’s look at what the code would look like.
class AnomalyDetector:

    def __init__(self, n_trees=10, height=8, window_size=72, seed=11):
        self.detector = anomaly.HalfSpaceTrees(
                                                n_trees=n_trees,
                                                height=height,
                                                window_size=window_size,
                                                # we are using 1200 as the max for this
                                                # dataset since we know in advance it
                                                # is the highest
                                                limits={'x': (0.0, 1200)},
                                                seed=seed
                                                )

    def update(self, data):
        data['score'] = self.detector.score_one({'x': data['PM2.5_CF1_ug/m3']})
        self.detector.learn_one({'x': data['PM2.5_CF1_ug/m3']})
        return self, data

flow.stateful_map(
    step_id = "anomaly_detector",
    builder = lambda: AnomalyDetector(n_trees=4, height=3, window_size=50, seed=11),
    mapper = AnomalyDetector.update,
)
You can see that we have moved the River pattern into a class initialization and update method. As well as the AnomalyDetector class definition, we have the stateful_map operator which has a builder and mapper function. The builder is something that will be called for each new key and the mapper will be called for each new sensor reading. In this case, we create a model with the predetermined parameters and then we score the sensor value and update the model with each new sensor value.
Differentiating Between Malfunctions and Fires
In our dataflow we were successfully able to integrate an online learning method for detecting anomalies. The code above returned anomalous sensor values that could either be smoke from a nearby fire or a malfunctioning sensor. To try and differentiate, we can use another capability enabled by the stateful capabilities of Bytewax. What we are going to do next is use one of the bytewax window operators that will allow us to accumulate sensor values over time while also aggregating by a key. So the idea is we can re-key our data that was in the format (sensor_id, payload) to be (sensor_region, accumulated_window) and then analyze the aggregated data to see if the anomalies persist across many sensors in a region and across time.
Accumulating and Aggregating the Data
We will start
# setup an event-time based window to be used with `created_at` field
def get_event_time(event):
    return event["created_at"] # here we could parse our time if not already in a datetime format

# We need to specify a wait time in for how long we would like to wait for out of order data.
cc = EventClockConfig(get_event_time, wait_for_system_duration=timedelta(hours=12))

# Manually set the start time for this dataflow, this is known for this dataset
start_at = datetime.strptime("2022-07-18 00:00:00 UTC", "%Y-%m-%d %H:%M:%S %Z").replace(tzinfo=timezone.utc)
wc = TumblingWindowConfig(start_at=start_at, length=timedelta(hours=12))

# Anomalies class to be used in the event-time window
class Anomalies:

    def __init__(self):
        self.sensors = []
        self.times = []
        self.values = []

    def update(self, event):
        self.sensors.append(event["coordinates"])
        self.times.append(event["created_at"])
        self.values.append(float(event["PM2.5_CF1_ug/m3"]))

        return self

flow.fold_window(
            step_id = "count_sensors",
            clock_config = cc,
            window_config = wc,
            builder = Anomalies,
            folder = Anomalies.update)
Above we have used the fold window operator which is similar to the stateful map in that it takes a function (builder) for each new key and a function (folder) to update with each new value as arguments that can be a Python object. It differs from the stateful map in that it is bound by time, the time can either be event time, in which the time in the payload is parsed or system time, in which case it uses the system time to determine when to start and stop the window. We define the time with the clock configuration and then the specifics of our window in the window configuration. fold_window also differs from stateful_map in that it will “fold” the data into a new data object to be passed through at the end of the window instead of the “map” functionality that will pass the object through for each value.
As a result, in the code above, we will receive input values from each sensor in a region and out of it we will get an Anomalies object with sensors, times and values attributes for a specific region and time. The attributes are lists that we can then use in future steps to try and determine if the sensor malfunctioned or it failed.
Heuristics for Differentiating Between Malfunctions and Fires
Note: This is by no means an exhaustive method for differentiating, but suitable for this demonstration.
Once we have the Anomalies object, the next objective is to label whether it is a malfiunction or not. To do this, we will take advantage of the fact that when there is smoke in a region from a wildfire, it normally will persist for over 24 hours and it will often inundate an entire region. We can use the number of sensors in a region, the number of anomalous readings and the variance in these readings as features to attempt to differentiate.
def convert(key__anomalies):
    key, anomalies = key__anomalies

    # check is more than one sensor anomalous
    count_sensors = len(set(anomalies.sensors))
    count_anomalies = len(anomalies.values)
    min_event = min(anomalies.times)
    max_pm25 = max(anomalies.values)
    sensors = set(anomalies.sensors)
    malfunction = False
    anom_variance = None

    if count_sensors < 2:
        if count_anomalies < 10:
        malfunction = True
        else:
            # simplification, if there is wild variance in the data it is
            # possibly a false positive
            anom_variance = variation(anomalies.values)
            if anom_variance > 0.3:
                malfunction = True

    return (key, {
            "sensors": sensors,
            "count_sensors": count_sensors,
            "count_anomalies": count_anomalies,
            "anomalies": anomalies.values,
            "min_event": min_event,
            "max_pm25": max_pm25,
            "variance": anom_variance,
            "malfunction": malfunction
            })

flow.map(convert)
This step in our dataflow will take the Anomalies object and use our rules to categorize the anomaly as a malfunction or as smoke from a nearby fire. This occurs via a map operator, so each Anomalies object, which was an accumulation of 12 hours of data will be processed. As a result of using a tumbling window, we will only see new alerts every 12 hours.
That is all we are going to cover in this post. The fold_window and stateful_map operators and how they can be used with an online ML approach to solving a problem. For the full functioning code, you can visit the repo or checkout the colab notebook.
If you enjoyed this content, give us a star on GitHub to follow along with new developments.
Stay updated with our newsletter
Subscribe and never miss another blog post, announcement, or community event.
Why I am joining Bytewax


